by Jay Wu
On August 21st, 2021, barely a week after New York City experienced record-setting rainfall from Hurricane Henri, that record was shattered by remnants from Hurricane Ida. The damage was devastating, killing at least 27 people in New Jersey and 16 in New York City.
Immediately after the hurricane, New Yorkers responded to the hurricane by both calling on their electeds for infrastructure investment and hitting the streets to provide care, clothing, foods, and help cleaning debris.
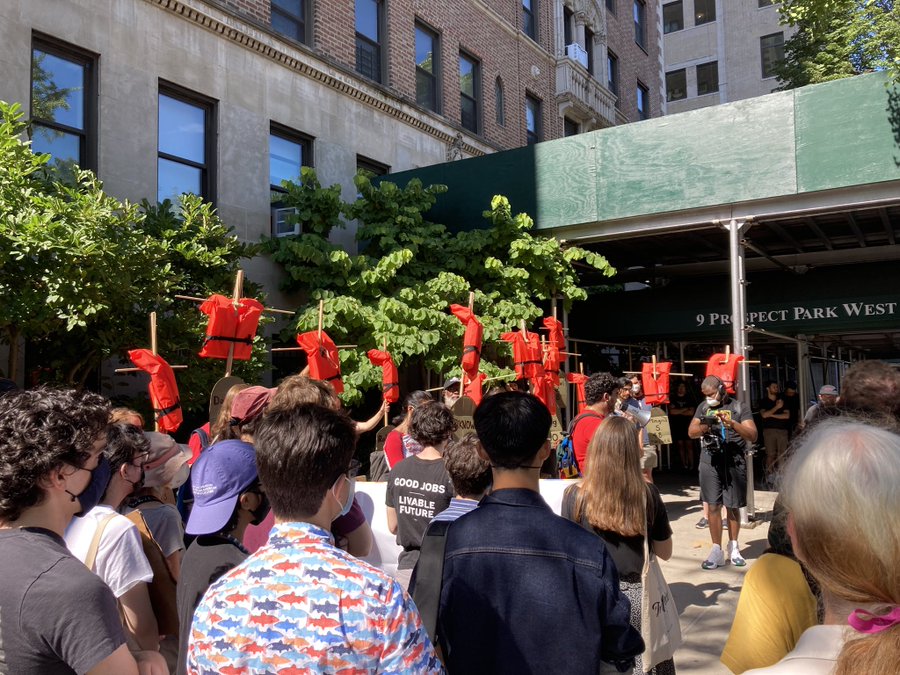
Protestors using life vests to depict Hurricane Ida’s casualties, from Sunrise NYC’s Twitter Account: https://twitter.com/sunrisemvmtnyc
I’ve begun meeting with local community organizers in Central and East Brooklyn to considers the long term economic effects of the hurricane as well. The economic toll of damaged cars, water heaters, and identification documents critical for immigrants’ employment, government programs, and assistance, hasn’t been accounted for yet. That’s why we’re identifying blocks hit particularly hard by the storm and talking to residents living there about their firsthand experiences from the hurricane.
To identify blocks heavily impacted by the storm, I first pulled 311 calls made during the week following Hurricane Ida from NYC Open Data and mapped them with QGIS. This data was illustrative, but didn’t quite match the reports I’d heard of extensive flooding in East New York. Conversations with community leaders suggested that depending on demographics and geography, many people almost never call 311—either due to lack of familiarity or to low expectations of a government response.
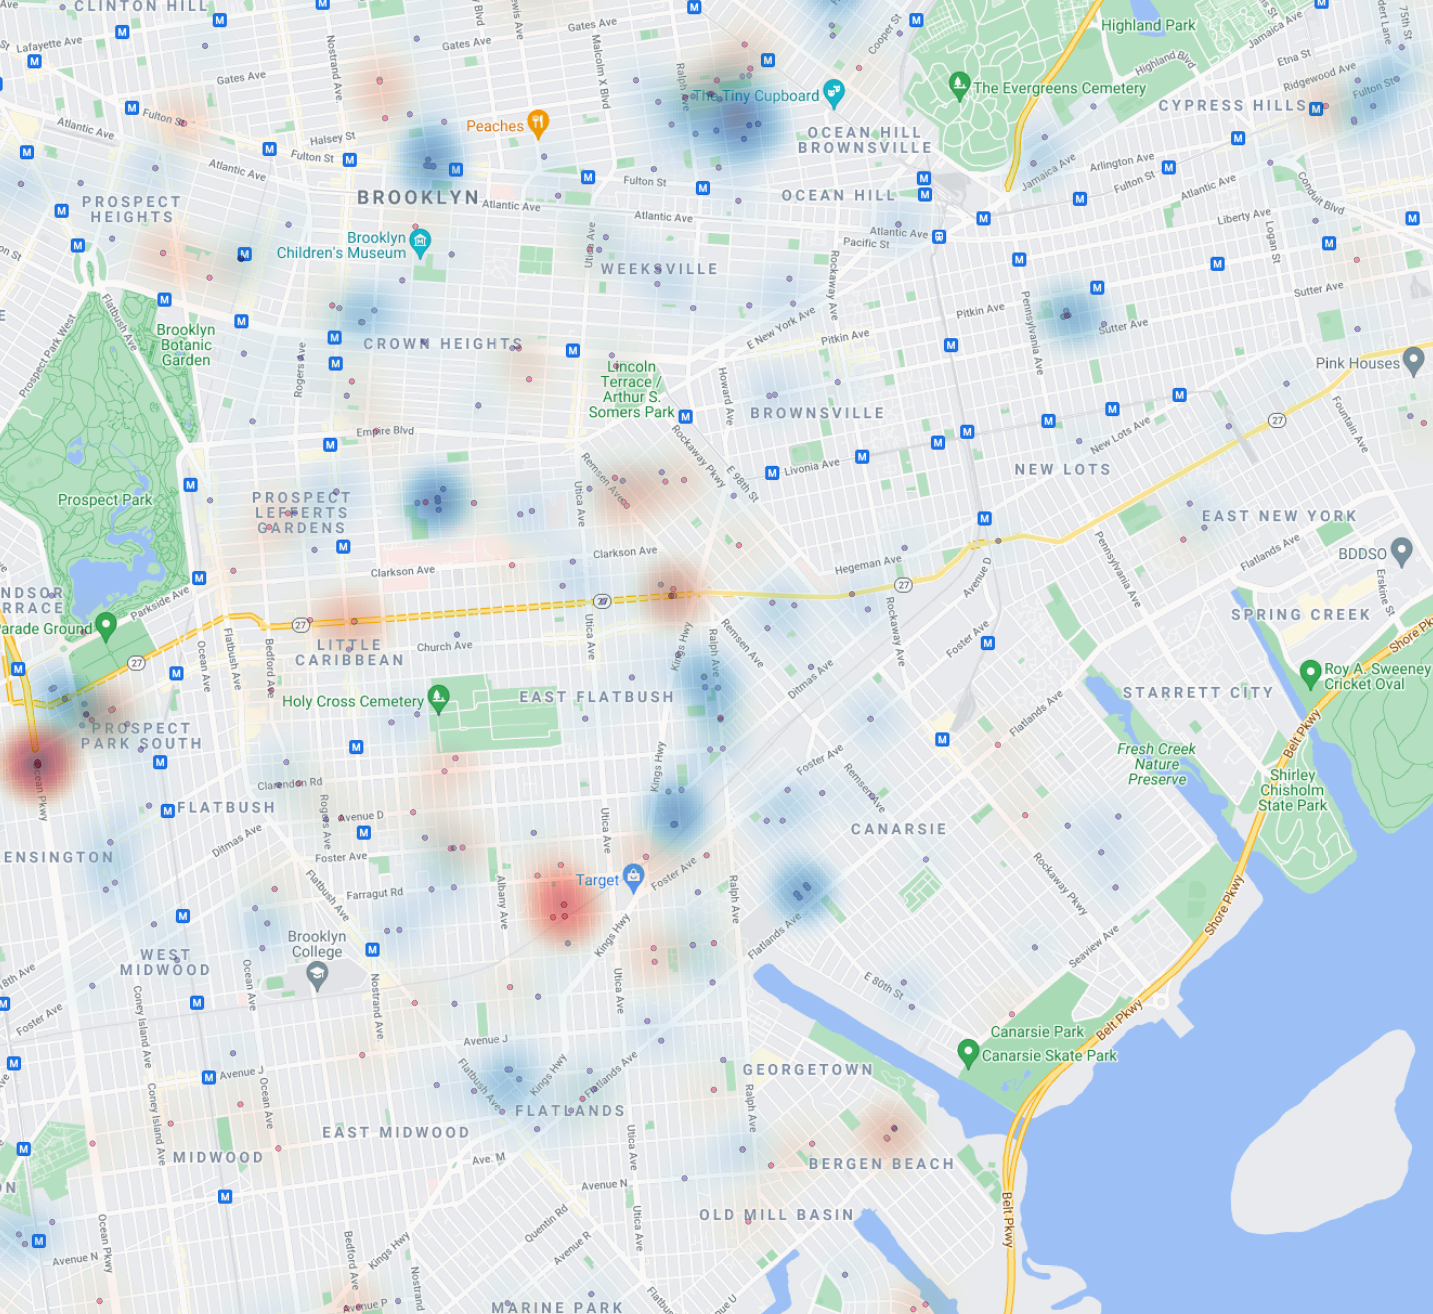
311 calls made during the week following Hurricane Ida (blue) and the week following Hurricane Henri (red) from NYC Open Data
With this information in mind, I added the NYC’s Extreme Stormwater Flood Map, which was released by the Mayor’s Office in May 2021. This map shows how low lying areas with little green space to soak rainfall suffer the highest flood risk due to rainfall. It doesn’t take into account factors such as disparate volumes of rainfall in different parts of the city, or uneven street drainage quality, which would also contribute to flooding after a specific weather event. It corresponds neatly with much of the 311 data, while also filling in some gaps, such as areas which likely flooded in East New York.
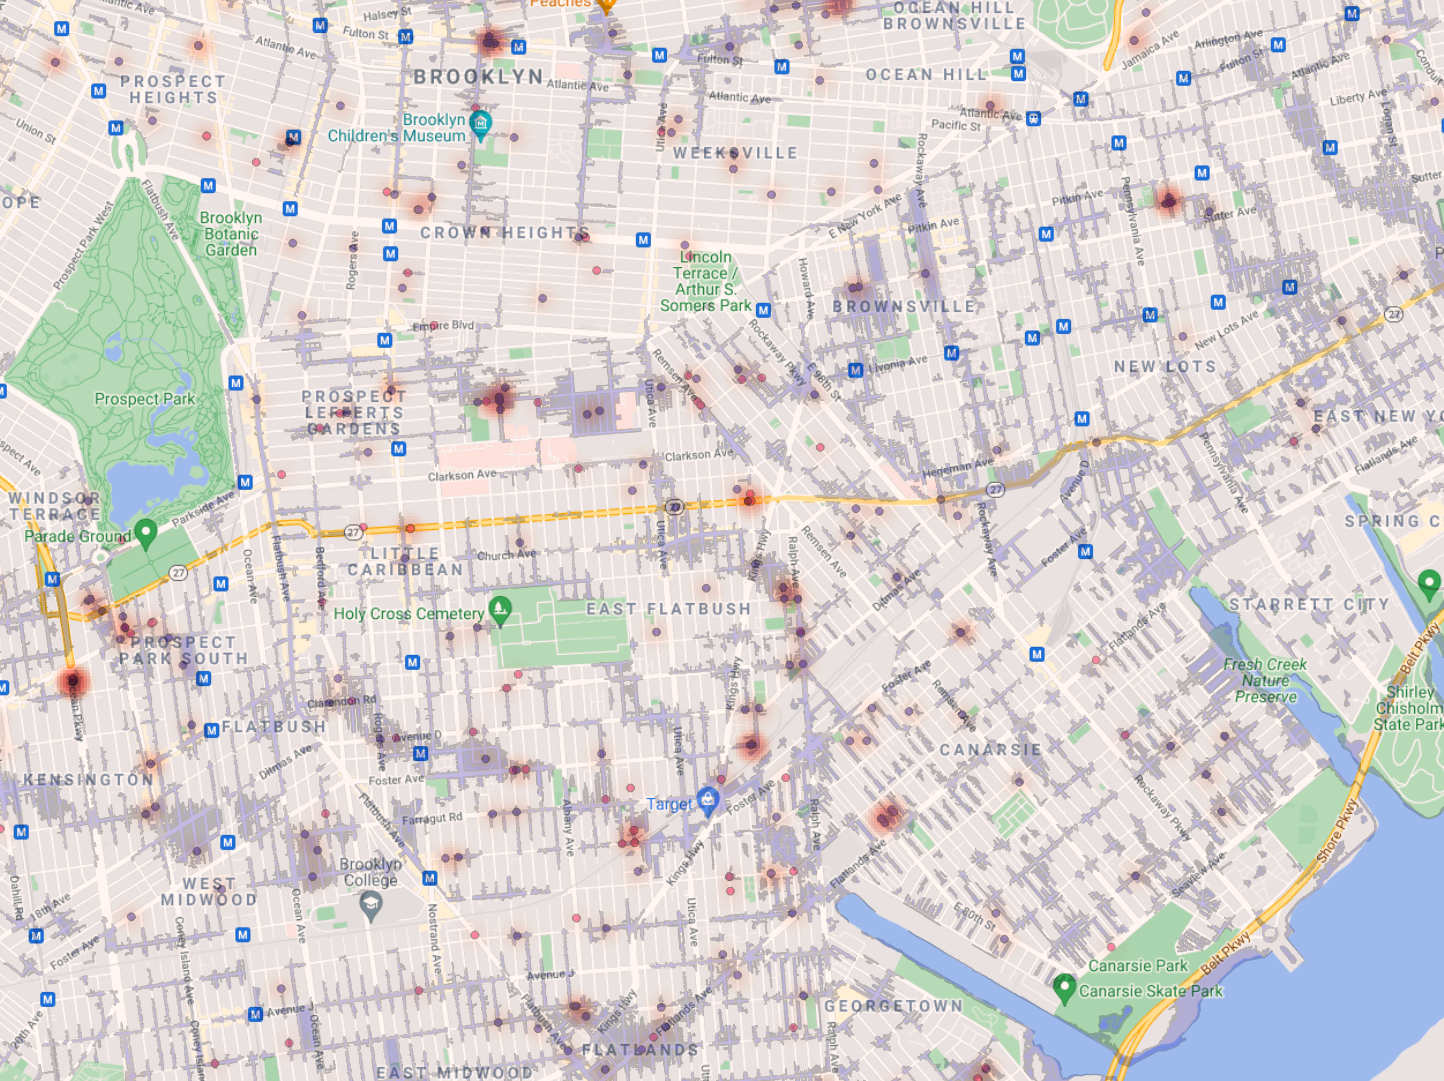
311 calls made during the week following Ida and Henri, overlaid with NYC’s Extreme Stormwater Flood Map
By combining these two maps, we can get a pretty good sense of which areas were hit hard by flooding with high granularity and start knocking on doors!